close

18: Developing simple models of key interactions

The behavior of social-ecological systems is influenced by the interactions between its component parts. These include key variables that span different sectors and scales, and respond to system drivers. Over time, these dynamics lead to a particular development trajectory. This work card describes how to approach the question “how does this system currently work?”

In a workshop setting, bring together stakeholders and technical expertise to explore the dynamics of key interactions. If there are a number of key interactions, have smaller groups work in parallel on the different interactions, then bring them together later in the workshop. Challenge participants to develop the simplest model of the key interaction that explains the most about the dilemma. You may want to complement these conceptual models with more technical and quantitative models over time.

Suggested approach: workshops

Time required: 1-2 hrs

Facilitation skill level: High – also requires advanced systems thinking skills

Resources: workshop materials, whiteboards, poster paper, markers, sticky notes

Ask at least 5 whys

There is no one correct way of approaching the question, “how does this system work?”. Exploring the relationships between key system variables that govern a system’s behavior can be done in many different ways. Our advice is to start by qualitatively focusing in on the more slowly changing system variables ( controlling variables), on potential thresholds and on key feedbacks.

Exploring system dynamics is the core technical element of Wayfinder. The main objective here is to deepen your understanding about how the system works, and how interactions between key variables in the system influence the overall development trajectory. Photo: iStock.

One way to start is to work backwards from the aspirations, system benefits and dilemmas by asking ’why?’ Asking at least 5 ’why’ questions can often reveal a huge amount of detail about how a system works. For example, it is increasingly common that marine life gets trapped and killed by ghost nets. But why do fishers lose so many nets that then start drifting around? Why are fishers forced to go further out to sea where they are exposed to more intense storms? Why are middle men supplying fishers with credit to purchase more powerful boats allowing them to travel further out to sea? Why do economic benefits of illegal fishing flow from the local fishers to wealthy operators located in other countries?

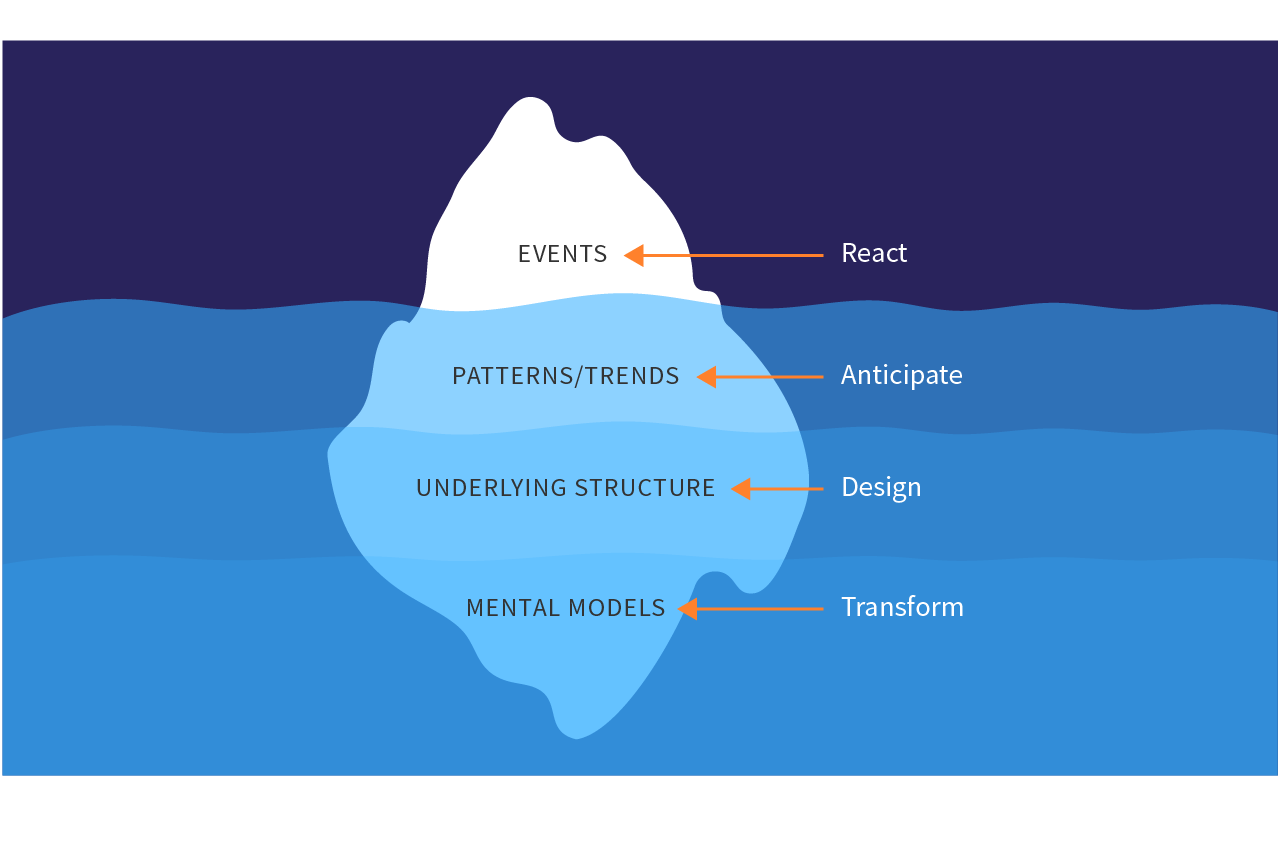
Remember the Iceberg figure we talked about earlier in the introduction and in work card 8? This drilling down into the system is designed to get you to look past the ’surface’ issue (e.g. drift nets killing marine life) to discover the underlying dynamics (weak governance arrangements allowing wealthy external operators to exploit the local economic conditions). While it is tempting to jump to solutions, you should continue to drill down as far as you can. At this stage, it is important to really engage with the complexity of the system. It is important to recognise here that the process of drilling down and understanding complex systems is messy and at times overwhelming. Eventually however a clearer picture will start to emerge. Later on, once you have a good idea about which relationships are really structuring the system, you can revise and refine your systems model making it simpler by reducing it to the key variables and critical dynamics that will help you to identify leverage points for systemic change.

Locating the dilemmas in the overall system dynamics

This deep exploration of dynamics should help you to ’locate’ the crux of the social-ecological dilemmas (figure 18.1), and also explain why the system generates a particular bundle of ecosystem services. Thus, the goal is to identify a smaller set of specific relationships between important system variables, given existing external drivers of change, that may explain the current state of affairs. A number of different tools can help you to approach this task.

  • To explore how one key variable behaves in response to existing drivers of change (e.g. how availability of land declines in response to population growth), make a simple ‘behavior over time graph’
  • To explore how a dependent variable changes in response to an independent variable (e.g. how crop yields decline in response to soil salinity), make a simple ’dependent/independent variable’ graphs
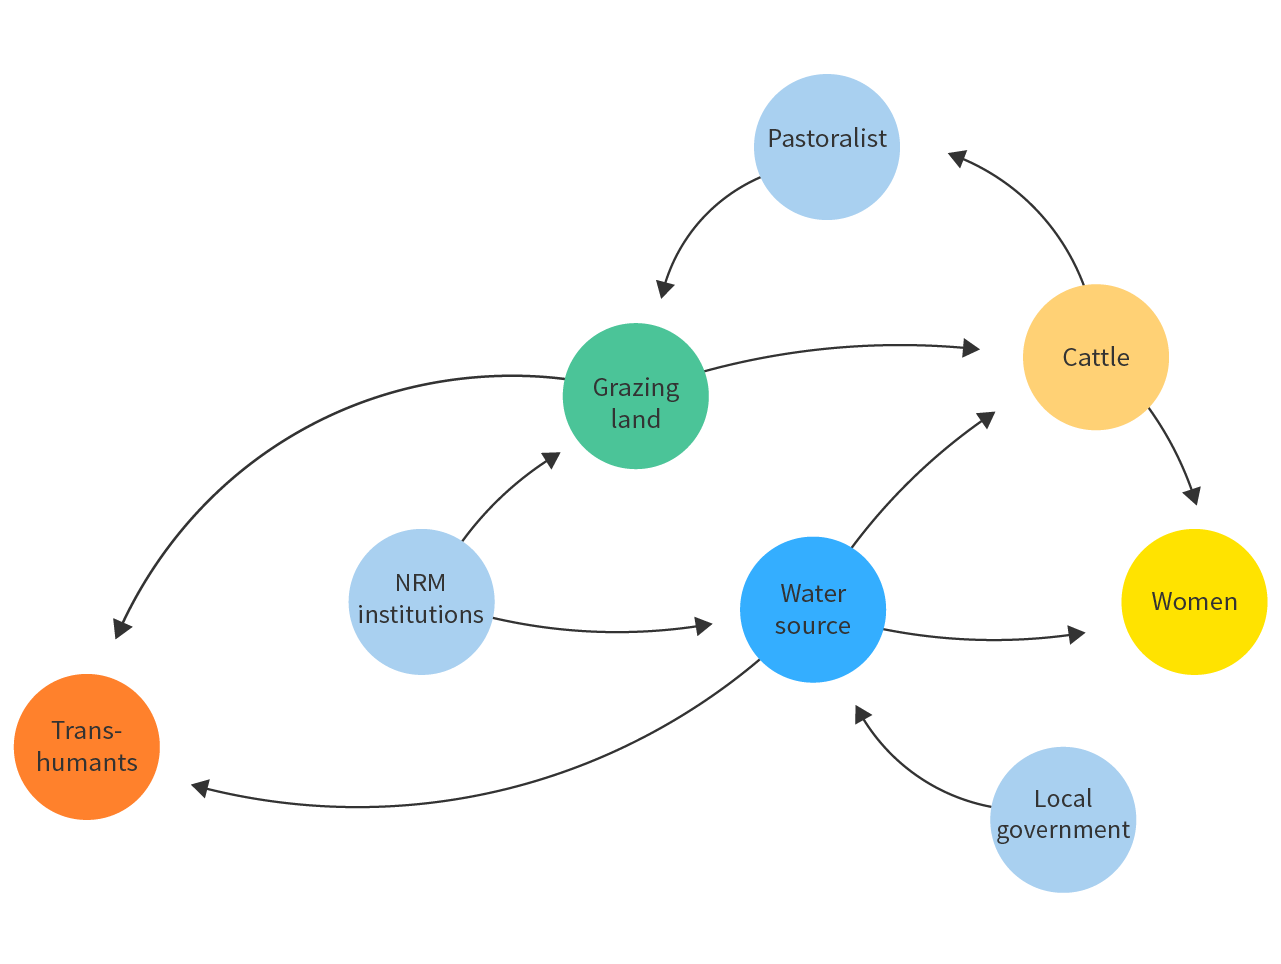
  • To explore relationships between individual system components, make an influence diagram that links the variables together. See the attached case from the Wayfinder process in Senegal, illustrating how key components in the pastoral system link to each other.
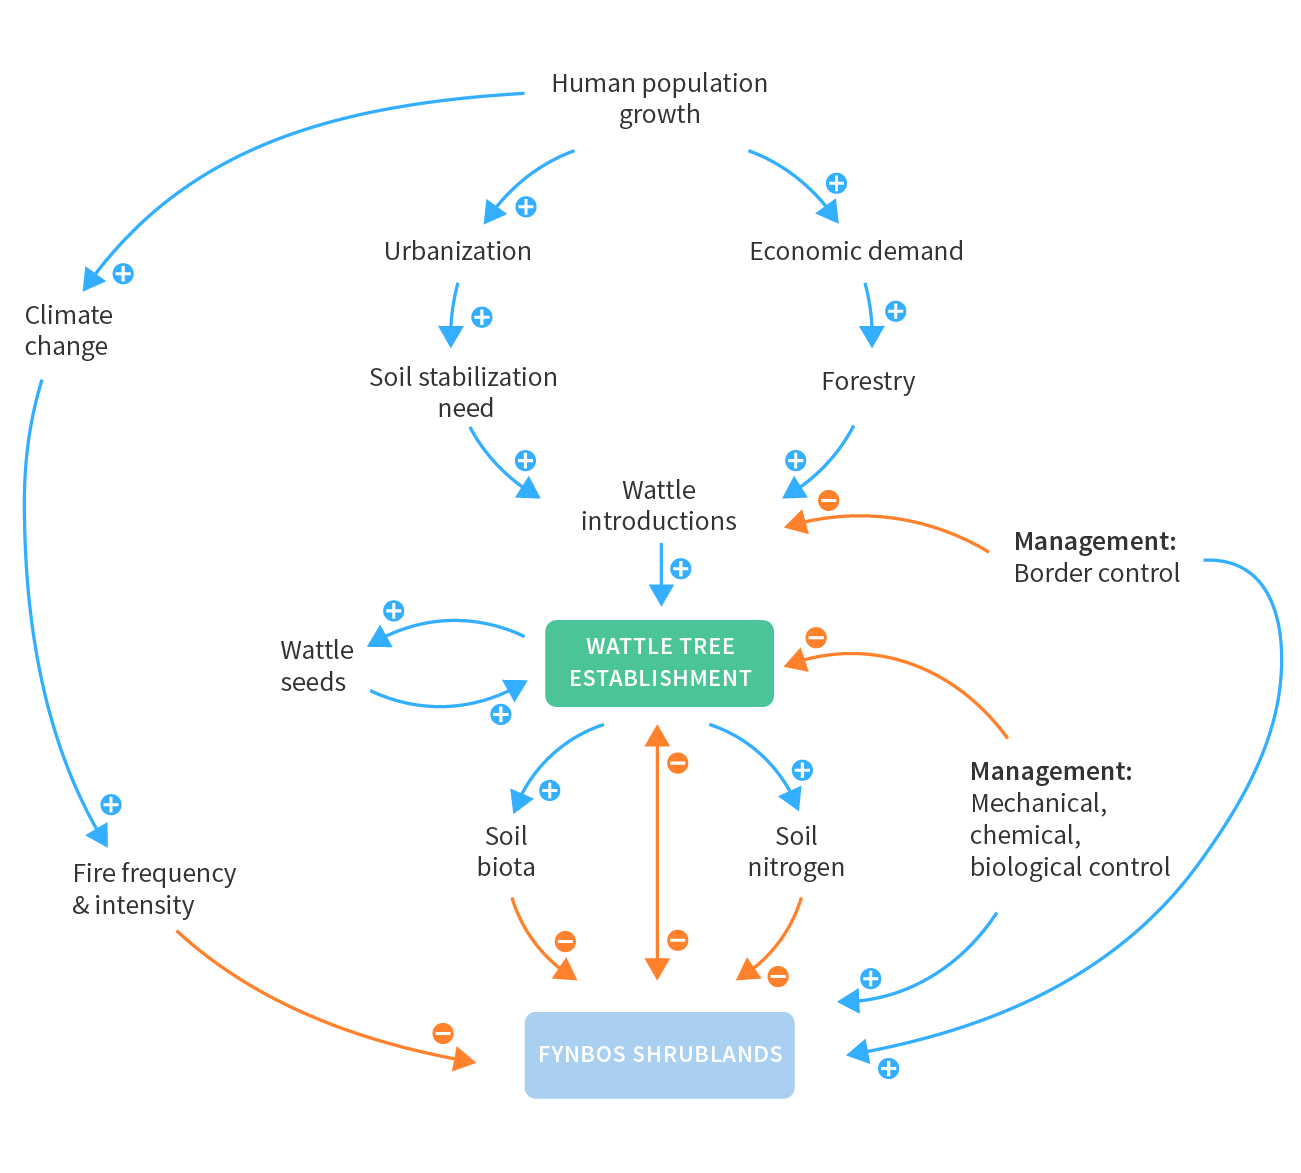
  • To further explore interactions and feedbacks make a ’causal loop diagram’ (figure 18.1), that characterizes the different feedbacks as either reinforcing or balancing. For example, education and income levels are strongly linked through a positive feedback, whereas social cohesion and crime are also strongly linked but through a negative feedback, meaning that the higher the social cohesion the lower the crime rate is, and the lower crime rate the higher social cohesion. See the attached case from South Africa, which shows a causal loop diagram of a fynbos system that has become dominated by invasive Wattle.

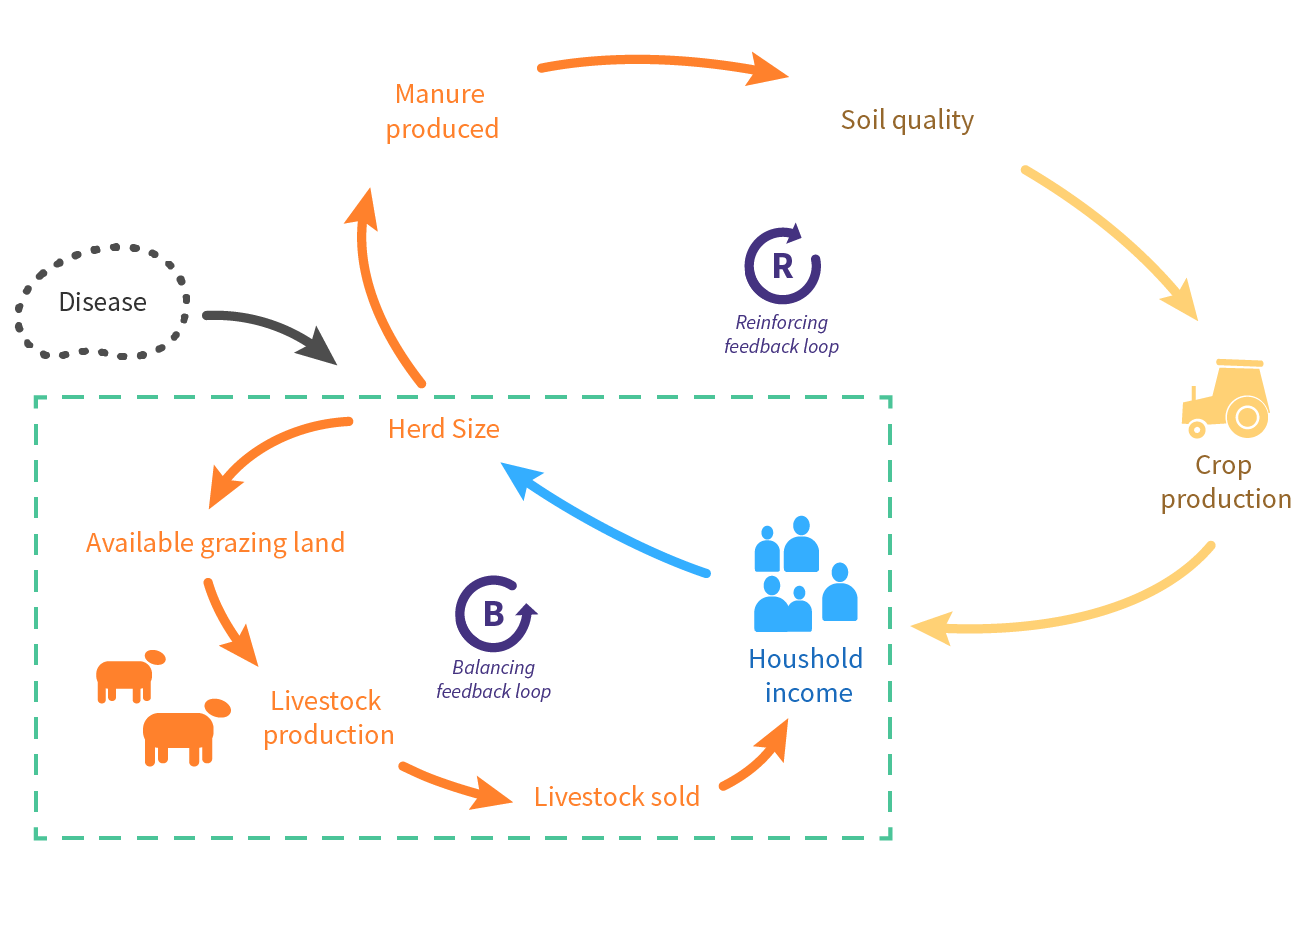
Figure 18.1. A causal loop diagram highlights how key social, economic and ecological system variables interact, in response to existing external drivers and shocks. These interactions sometimes take the form of feedbacks, which may either have a reinforcing or a balancing impact on system behavior. Locating a social-ecological dilemma in the overall system dynamics is important to be able to design effective solutions. In this stylized agro-pastorlist example, the problems evolve around the lack of grazing land which hampers livestock production, which also has an impact on farmland management. Illustration: E.Wikander/Azote

Start qualitatively rather than quantitatively

When analyzing system dynamics, there is a tendency to look to quantitative models. We want to stress here that it is more important at this stage to identify the key variables and relationships between them, than to pursue a detailed quantitative model of a specific part of the system. Later on, quantitative models on specific system dynamics can be very useful to test hypotheses, but to start this analysis you may begin by simply drawing on a whiteboard or piece of butchers’ paper, preferably with key stakeholders involved. This process is often enough to generate a set of key insights about how the system works.

Keep in mind that you are exploring and learning, so you should feel free to play around with different approaches until you feel you gain a better understanding of how the system works, rather than trying to get it exactly right with one specific approach. The aim here is for you, your coalition and key stakeholders to rapidly gain new insights into key system dynamics. If something is not working, don’t persist with the same approach, instead try a different type of analysis, go up a level in complexity, change the starting point, come back to the issue later. or consult with someone else with a different perspective. It is also important to remember that while you have ’located’ or framed the social-ecological dilemmas in one way now, that may very well change later, as your understanding of system dynamics evolves.

Document assumptions and evidence

Underlying any model are assumptions. For example, in a system that relies on irrigated crops, there may be assumptions made regarding the amount of water available, the suitability of the type of crops being grown, or the market value of the crops. It is critical to be clear about whatever assumptions exist about the system and how this is represented in the model. They need to be articulated and critically reviewed using data and evidence where available. Where data or other evidence is not available, you may need to test your assumptions through small-scale experiments as part of implementation. Also, you should consider if there are there opportunities to learn about your assumptions from others or existing activities that are currently taking place in the system or similar systems elsewhere.

The models that you create will never be exact or fully correct. You should rather see them as a developing hypothesis based on your current understanding and the information and evidence that is available at the moment. This mindset is very important for being successful in phases 4 and 5 of Wayfinder.

Open this card Close this card
close

19: Identifying thresholds and traps

Once you have created a set of models that provisionally explain how the system works, it is useful to take a step back, look at these models, and reflect on specific types of system dynamics that are of particular importance for navigating towards a more sustainable, safe and just future. This work card describes how you can identify thresholds of potential concern and social-ecological traps.

In a workshop setting, bring together stakeholders and technical expertise to look at the outputs of work card 18 to identify potential thresholds and traps. Ask participants to list thresholds of potential concern, reflecting on how the may interact. Ask them to draw causal loop diagrams reflecting the feedbacks involved in maintaining any potential traps. You may want to try a state and transition model as well.

Suggested approach: workshops

Time required: 2-3 hrs

Facilitation skill level: High – also requires advanced systems thinking skills

Resources outputs of work cards 10, 12 and 18, workshop materials, whiteboards, poster paper, markers, sticky notes

 What is a threshold of potential concern?

Social-ecological systems change gradually but can also change abruptly. When they change abruptly, it is often because one or more thresholds in the system have been crossed, which leads to a change in system dynamics, including system feedbacks, whereby the system may start to develop along a different development trajectory. Sometimes that type of change is irreversible, at least from a practical perspective. These types of “regime shifts” have been identified in many different systems, including for example in clear-water lake shifting to turbid-water lakes, in coral reefs shifting to algae-dominated reefs and in savannahs becoming overgrown with bush. A regime shift can lead to a loss of important system benefits, in which case it can be regarded as a ‘trap’ (see below). A more detailed description of a regime shift can be found in the attached case from the Black Sea, which has shifted from a top predator dominated state to a jellyfish dominated state.

Girl swimming in a soup of algal bloom in the Baltic Sea, Gotland, Sweden. Sometimes social-ecological systems can shift abruptly, going through a “regime shift” whereby important system benefits are lost. The recent shift to more frequent summer algal blooms in the Baltic Sea, related to to eutrophication and land use change, can be seen as a regime shift, where among e.g. opportunities for recreation are lost. Photo: A. Maslennikov/Azote.

Some of these shifts occur due to ecological thresholds, but keep in mind that there may also be social thresholds, beyond which the system starts behaving differently. Those are defined by social preferences, such as the critical number of people involved in an activity so that it becomes a new norm, the point at which the number of children at a school fall below the critical level for the school to remain open, the amount of produce required for a local food processing to commence, the distance at which it become no longer economically viable to transport food to a market are all examples of threholds, or the amount of forest destruction a community will tolerate before wanting to limit further logging.

Building awareness around thresholds

Being aware of thresholds of potential concern in the system and actively working to avoid them is an important part of navigating towards more sustainable trajectories. But this is challenging, since thresholds are difficult to detect, and often only discovered after they have been crossed and the consequence are felt. A first step to keep track of potential thresholds in your system, is to build awareness around the existence of thresholds and the effects they may have on a system. Some organizations, such as the South Africa National Parks and the Avon Basin Natural Resources Management Agency in Australia, have fully integrated threshold monitoring into their management plans. In the Avon basin they have created a useful report-card type of approach to monitor and keep track of potential thresholds across different domains in their system (see attached case).

Social-ecological systems can get ‘trapped’

In addition to thresholds, another particular type of system dynamics important to be aware of is ‘‘traps’. Social-ecological systems can become locked into situations that are undesirable but difficult to escape, i.e. they can get stuck in a trap. Traps arise due to self-reinforcing feedbacks between key system variables that keep the system locked into on an undesirable trajectory. In a trap, system benefits remain low or even decline over time, which is often the case after the system has undergone an unplanned regime shift. The crossing of an important threshold in the system may change the dynamics so that a trap is formed.

A basic example of a trap is a household with low assets that is unable to invest in education, and as a consequence their potential for further accumulating assets remains low (figure 19.1). This is often referred to as a poverty trap, and they may have other important interacting variables as well, such as health or social capital. Another example of a trap are fishermen who buy bigger boats to compensate for declining fish catches. By doing so they become indebted and they have to fish even more (in absence of alternative livelihoods), with declining fish population as a likely consequence (see attached case on the Maine lobster fishery).

Escaping a trap

To navigate towards more sustainable futures, it is important to identify if the system, or parts of it, is caught in a trap. This has important implications for what kind of strategies you should design. Traps generally requires that we move beyond adaptive responses, towards more transformative change. Quick fixes that only treat the symptom of the problem are unlikely to unlock a trap. In fact, this may actually make the situation worse in the long run, as adaptive responses (in contract to transformative ones) have a tendency to reinforce current system feedbacks. Instead, to break out of a trap, you need to target the root causes of the problem and destabilize the feedback that maintains the situation. Unlocking a trap will often require coordinated efforts across sectors and scales. For example, in the poverty trap example above, it is unlikely that providing households with more capital will automatically lead to improved education levels, the education and (health) system might need to be reformed as well.

Figure 19.1. A simplified example of a lock-in situation, also called a trap. Reinforcing feedbacks keep the system in an impoverished state. In this simple example low levels of assets prevents investments in education, which further reduces the prospects for accumulating assets. Illustration: E.Wikander/Azote

Click here to learn more about traps and regime shifts by Jamila Haider, Postdoctoral Researcher with GRAID at the Stockholm Resilience Centre and Garry Peterson, Professor at the Stockholm Resilience Centre

Identifying thresholds and traps

A first important step in managing threshold and traps is simply to acknowledge that they may exist in your system. This is an important mind-set to adopt, because navigating towards a more sustainable future, will require that we take precautions and build buffers to thresholds, and that we respond in an appropriate way to traps. Then, to better understand these dynamics, examine controlling variables that change slowly, since they are often involved in both thresholds and traps.

Use the information that you collected in Phase 2, work card 10 on system benefits and work card 12 on historical changes, in combination with the detailed analysis of interactions between key system variables just performed in work card 18, explore thresholds of potential concern and the existence of trap dynamics in your system. Try to come up with a synthesized model of system dynamics that broadly explains how your system currently work. Use the attached discussion guide and two attached activity sheets to help your exploration and synthesis.

Open this card Close this card
close

20: Cycles of change linked across scales

Another important aspect of system dynamics is how change happens over time. Many systems go through what can be described as cycles of change, passing through different phases. Systems experiencing these cycles are often linked together across scales, which has important implications for developing strategies to navigate towards a more sustainable future. This work card helps you analyze cycles of change in your system.

In a workshop setting, explain the adaptive cycle idea, then explore how the focal system has changed historically through this lens. Then look at scales above and below, to identify elements of memory and revolt. You may want to have different groups in the workshop working at different scales simultaneously, then bring the scales together to synthesis the whole story of linked scales and change over time. 

Suggested approach: small meetings with stakeholder representatives and if useful technical experts

Time required: 1-2 hrs

Facilitation skill level: High – requires advanced systems thinking skills

Resources: annotated adaptive cycle diagrams, workshop materials, whiteboards, poster paper, markers, sticky notes

 Understanding system dynamics over time

You have now explored systems dynamics in some detail, and you should by now have integrated your understanding of system interactions, thresholds, and traps into a conceptual model that reasonably well explains how the system functions at present. However, systems change continuously, and it is therefore important to reflect on how system dynamics evolves over time.

Many systems go through what can be described as cycles of change, passing through different phases that can be characterized as: growth, maintenance, collapse, and reorganization. This pattern of change has been called an adaptive cycle. It reflects the development of a system from when it first becomes established, through a long period of maturing and stabilizing, where the system gradually becomes less flexible and more vulnerable to the shocks that sooner or later inevitably will hit the system, unravelling the structure and leading to collapse. This provides an opportunity for the system to reorganize and either rebuild in a similar way (through the same interactions between key system variables), or to adapt or transform along a new trajectory of development.

Forest wildfire in the Rocky Mountains, Bailey, Colorado, USA. Many systems go through cycles of change, passing through stages of growth, conservation, collapse and reorganization. Forest development, including their fire regimes, are a well-known example. Photo: iStock.

Memory and novelty

As discussed in work card 15, change over time in a system is influenced by what happens at other scales. As our world becomes increasingly connected, cycles of change are increasingly linked across scales (figure 20.1).

Figure 20.1. Adaptive cycle, linked across scales. Many systems go through what can be described as cycles of change, passing through different phases that can be characterized as: growth, maintenance, collapse, and reorganization. Larger scales often have a constraining effect on smaller scales, whereas events at smaller scales often create change at larger scales. Illustration: E.Wikander/Azote, adapted from Gunderson and Holling (2002).

At larger scales there may be national policies or market forces, but also environmental processes such as regional climate patterns that constrain what is possible at the focal scale during the reorganization phase and provide “memory” for the system. Similarly, at smaller scales, processes occurring at for example, the individual level, the farm level, or the community level, feed up into the system of focus. It is often through these smaller scales that novelty is introduced into the system, creating “revolt”, exemplified through many of the successful local social movements that we have seen in recent years that often have started as shadow networks operating in the margins of the system and challenging the current state of affairs until the system collapses at a larger scale.

These cross-scale interactions mean that solutions to many problems probably will lie outside the boundaries of the focal system. Importantly, this also means that proposed solutions need to consider the larger spatial and temporal context including how actions at one level may impact other places now and in the future. It is therefore useful to reflect on patterns of change over time in your system, and how it links to processes at other scales. The attached discussion guide can help structure your analysis of how cycles of change, linked across scales, may be relevant for your system.

Open this card Close this card